


Graphing Two-Variable Linear Inequalities
Purplemath
First off, let me say that graphing two-variable linear inequalites in the x,y-plane is much easier than your textbook makes it seem.
Think about how you've solved one-variable linear inequalites on the number line. Suppose they'd asked you to graph something like x > 2. How did you do that?

You found your solution by drawing your number line and finding the "equals" part (in this example, x = 2). Then you marked this point with the appropriate notation; namely, an open dot or a parenthesis, indicating that the point x = 2 wasn't included in the solution. Then you'd shade everything to the right, because "greater than" meant "everything off to the right".
The steps for graphing two-variable linear inequalities are very much the same as for graphing the one-variable case.
What are the 4 steps for graphing linear inequalities?
- Solve the inequality to get y alone on one side.
- Replace the inequality symbol with an "equals" sign, creating a straight-line equation.
- Graph the equation.
- If the original inequality was an "or equal to" one, then draw a solid line for the graph.
- If, on the other hand, the original inequality was a "strict" inequality, then draw a dashed line for the graph.
- Shade one side of the straight line.
- If the solved inequality was "y greater than", then shade above the line.
- If the solved inequality was "y less than", then shade below the line.
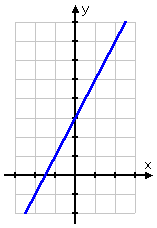
- Graph the solution to y ≤ 2x + 3.
Just as for one-variable linear number-line inequalities, my first step for this two-variable linear x,y-plane inequality is to find the "equals" part of the inequality. For two-variable linear inequalities, the "equals" part is the graph of the straight line; in this case, that straight line is y = 2x + 3.
And, because this particular inequality is an "or equal to" inequality, this tells me that the straight line is included in the solution; in particular, I should draw my line as a solid line, rather than as a dashed line:
Okay; the line has given me the boundary between the solution region (being the portion of the plane that solves the inequality) and the not-a-solution region.
Now I'm at the point where the textbook tends to get complicated, with talk of "test points" and such. But back when I did one-variable inequalities (like x < 3), I didn't bother with "test points"; I just shaded one side or the other. I can do the same here.
I'll ignore the "test point" stuff, and instead look at the original inequality, y ≤ 2x + 3.
I've already graphed the "or equal to" part — it's just the line, which is the border of the solution region. Now I'm ready to do the "y less than" part. In other words, this is where I need to shade one side of the line or the other.
Now think about it: If I need y less than the line, do I want above the line, or below?
Naturally, I want below the line. So I shade in that portion of the plane:
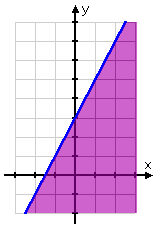
The plane, containing the line and a shaded side, is the "solution region" they're wanting. That's all there is to it!
This technique (of looking at the original inequality to see which side to shade) worked because we had y alone on one side of the inequality. Just as was the case back when you were graphing plain old straight lines, you always want to solve for y to be alone on one side. Doing so makes everything else simpler and, for inequalities like this, saves the annoyance of doing test points.

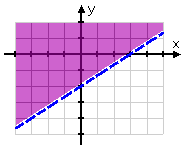
- Graph the solution to 2x − 3y < 6.
First, I'll solve the inequality to get y alone on one side:
2x − 3y < 6
−3y < −2x + 6
[Notice how I the flipped inequality sign in the last line. I mustn't forget to flip the inequality if I multiply or divide through by a negative.]
Now I need to find the "equals" part, which is the line y = (2/3)x − 2. That line looks like this:
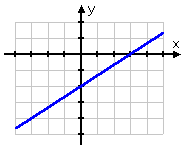
Okay; the "equals" part has given me the line, which is the boundary between the solution region and the not-a-solution region.
But this exercise is what is called a "strict" inequality. That is, it isn't an "or equal to" inequality; it's only "y greater than". So this affects the "equals" line.
When I had strict inequalities on the number line (such as x < 3), I denoted this by using a parenthesis (instead of a square bracket) or an open [unfilled] dot (instead of a closed [filled] dot).
In the case of these two-variable linear inequalities, the notation for a strict inequality is a dashed line. So the border of my solution region actually looks like this:
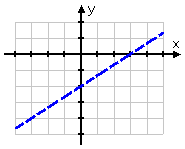
By using a dashed line, I still know where the border is, but I also know that the border isn't included in the solution. And, since this is a "y greater than" inequality, I know that I want to shade above the line, so my solution looks like this:
© 2024 Purplemath, Inc. All right reserved. Web Design by ![]()