


Graphing Quadratics: The Leading Coefficient & The Vertex
Purplemath
What is the leading coefficient of a quadratic function?
In a quadratic function y = ax2 + bx + c, the "leading coefficient" is the numerical part of the squared-variable term. In the generic quadratic function, the squared-variable term is ax2, so a is the leading coefficient.
(Why is this coefficient called the "leading" coefficient? Because, once the terms of a quadratic are arranged in "descending order" [according to the exponents on the variables], the ax2 term will be the first term. And any number that's multiplied by a variable is called that variable's coefficient.)
How do you find the leading coefficient?
To find the leading coefficient, locate the leading term (that is, locate the term with the squared variable), and read off the numerical part. This number (that was multipled by the squared-variable part) is the leading coefficient. For instance, in each of 3x2 + 2x - 5 and 7 − 5x + 3x2, the leading coefficient is 3.
How does the leading coefficient affect the shape of the parabola?
With respect to graphing, the leading coefficient indicates how fat or how skinny the parabola will be. If the coefficient is a large number, then the graph will grow more quickly and the parabola will be taller and thinner than the basic quadratic graph. If the coefficient is between 0 and 1 (non-inclusive), then the quadratic will grow more slowly, so the parabola will be shorter and fatter.
In other words, given the generic quadratic function y = ax2 + bx + c, the following are true:
- For | a | > 1 (such as a = 3 or a = −4), the parabola will be skinny, because it grows more quickly (three times as fast or four times as fast, respectively, in the case of our sample values of a).
- For | a | < 1 (such as or ), the parabola will be fat, because it grows more slowly (one-third as fast or one-fourth as fast, respectively, in the examples). Also, if a is negative, then the parabola is upside-down.
You can see these trends when you look at how the curve y = ax2 moves as "a" changes:
As you can see, as the leading coefficient goes from very negative to slightly negative to zero (which isn't actually a quadratic) to slightly positive to very positive, the parabola goes from skinny upside-down to fat upside-down to a straight line (called a "degenerate" parabola) to a fat right-side-up to a skinny right-side-up.
There is a simple, if slightly dumb, way to remember the difference between right-side-up parabolas and upside-down parabolas:
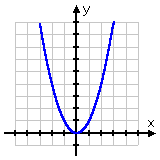
positive quadratic y = x2

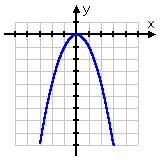
negative quadratic y = −x2

This can be useful information: If, for instance, you have an equation where a is negative, but you're somehow coming up with plot points that make it look like the quadratic is right-side-up, then you will know that you need to go back and check your work, because something is wrong.
What is the vertex of a parabola?
Parabolas always have a lowest point (or a highest point, if the parabola is upside-down). This point, where the parabola changes direction, is called the "vertex".
If the quadratic is written in the form y = a(x − h)2 + k, then the vertex is the point (h, k).
This location of the vertex makes sense (in terms of the vertex-form of the equation), if you think about it. The squared part of y = a(x − h)2 + k is always positive (for a right-side-up parabola), unless it's zero. So you'll always have that fixed value k, and then you'll always be adding something to it to make y bigger, unless of course the squared part is zero. So the smallest y can possibly be is y = k, and this smallest value will happen when the squared part, x − h, equals zero. And the squared part is zero when x − h = 0, or when x = h.
The same reasoning works, with k being the largest value and the squared part always subtracting from it, for upside-down parabolas.
(Note: The "a" in the vertex form y = a(x − h)2 + k of the quadratic is the same as the "a" in the common form of the quadratic equation, y = ax2 + bx + c.)
Since the vertex is a useful point, and since you can simply read off the coordinates for the vertex from the vertex form of the quadratic, you can see where the vertex form of the quadratic can be helpful, especially if the vertex isn't one of your T-chart values.
However, quadratics are not usually written in vertex form. You can complete the square to convert ax2 + bx + c to vertex form, but, for finding the vertex, it's simpler to just use a formula. (The vertex formula is derived from the completing-the-square process, just as is the Quadratic Formula. In each case, memorization of the formula is probably simpler than completing the square for every exercise.)
How do you find the vertex?
For a given quadratic y = ax2 + bx + c, the vertex (h, k) is found by computing , and then evaluating y at h to find k. If you've already learned the Quadratic Formula, you may find it easy to memorize the formula for k, since it is related to both the formula for h and the discriminant in the Quadratic Formula: .
(Frankly, I find it simpler to simply plug the value I got for h into the quadratic function, and simplify to get the value of k. You do whichever works better for you.)
- Find the vertex of y = 3x2 + x − 2 and graph the parabola.
To find the vertex, I look at the coefficients a, b, and c. The formula for the vertex gives me:
Then I can find k by evaluating y at :
So now I know that the vertex is at . Using the formula was helpful, because this point is not one that I was likely to get on my T-chart.
I need additional points for my graph:
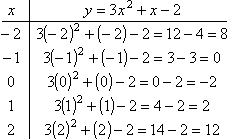
Now I can do my graph, and I will label the vertex:
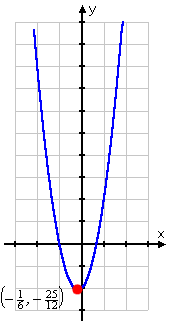
vertex:
When you write down the vertex in your homework, write down the exact coordinates: . But for graphing purposes, the decimal approximation of (−0.2, −2.1) may be more helpful, since it's easier to locate on the axes.

The only other consideration regarding the vertex is the "axis of symmetry".
What is the axis of symmetry of a parabola?
If you look at a parabola, you'll notice that you can draw a vertical line right up through the middle which would split the parabola into two mirrored halves. This vertical line, passing right through the vertex, is called the axis of symmetry. If you're asked for the axis, write down the line "x = h", where h is just the x-coordinate of the vertex. So in the example above, then the axis would be the vertical line .
Helpful note: If your quadratic's x-intercepts happen to be nice neat numbers (so they're relatively easy to work with), a shortcut for finding the axis of symmetry is to note that this particular symmetry axis, this particular vertical line, is always exactly between the two x-intercepts. So you can just average the two intercepts to get the location of the axis of symmetry and the x-coordinate of the vertex. However, if you have messy x-intercepts (as in the example above) or if the quadratic doesn't actually cross the x-axis (as you'll see on the next page), then you'll need to use the formula to find the vertex.
© 2024 Purplemath, Inc. All right reserved. Web Design by ![]()