


Graphing: Plotting Points & Drawing Lines
Purplemath
What does it mean to graph a linear equation?
Graphing a linear equation means finding points for the equation, drawing a neat axis system, plotting those points, lining a ruler up against them, and drawing the straight line. That's really all there is to it.

On the previous page, I filled out my T-chart for the equation y = 2x + 3.
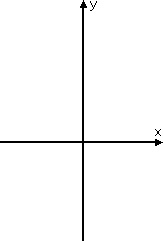
Now that I have my points, I need to prepare for graphing. The first step is to draw my axes; that is, the horizontal and vertical number lines that form my graphing area.
To draw the axes, I must use my ruler! If I don't use a ruler, I will have messy axes and inconsistent scales on the axes, and it would be highly unlikely that my points would line up nicely.
(Don't "fake it" when drawing your graphs. Get in the habit now of drawing neatly. It will save you so much trouble down the line. And, no, using graph paper is not the same as, nor does it replace, using a ruler.)
Let's return to the exercise. To refresh, the question was:
- Graph y = 2x + 3. Show all work.
On the previous page, I'd completed my T-chart:

Now I have to draw my graphing area (that is, I have to put on paper what would be the "window" on a graphing calculator). I must make sure that I draw my axis system large enough that my graph will be easily visible.
On a standard-sized sheet of paper (8.5 by 11 inches, or A4), I will be able to fit two or three nice, clear graphs on a page. If I am fitting more than three graphs on one side of a sheet, then I'm probably drawing them too small.
Here is my axis system:
Remember that the arrows indicate the direction in which the values are increasing. Your book (and even your teacher) may draw things incorrectly, but that's no excuse for you. Arrows go on the upper numerical ends of each axis, and nowhere else — unless you have an educator who wants it drawn wrong; then just remember the right way for later courses. (I'm talking to *you*, Americans! The rest of the world looks at the double-arrowed axes in American textbooks, and weeps!)
Once I've drawn my axes, I have to label them with an appropriate scale.
"Appropriate" means "a scale that is drawn neathly and that suits the numbers with which I'm working". For instance, considering the values I'm working with in the T-chart above, I'll count off by ones on the axes. But if I were doing a graph for a word problem about government waste, I would probably count off by millions or maybe even by billions. I adjust the scales and axes to suit the case at hand, and I always use a ruler to make sure that my tick-marks are even.
Here's my axis system with the scale added to the two axes:
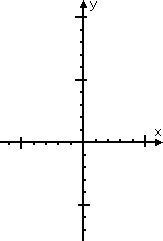
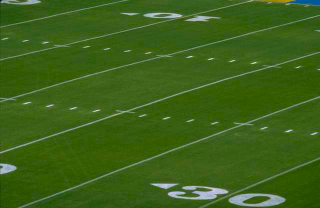
Note that I've made every fifth tick-mark a bit longer. This isn't a rule, but I've often found it helpful for counting off the larger points; it's more of a time-saver than anything else. It's similar to how yardage is marked on American-football fields (as distinct from the fields for the-rest-of-the-world football, which Americans call "soccer"):

I draw my one-unit tick-marks on only one side of the axis, but that's just so they don't run into each other near the origin, where the two axes cross. Otherwise, it can get crowded in there. But this style is just my personal preference.
By the way, if you don't use a ruler or take a modicum of care in your work, your graphs will look like what math instructors are more accustomed to seeing:


I'm not kidding; people really hand in "work" that looks like this. Please don't be one of those people!
Now I'll plot (that is, I'll draw) the points I'd computed in my T-chart:
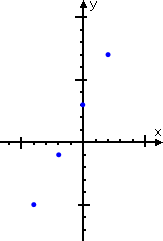
...and then I'll finish up by connecting the dots:
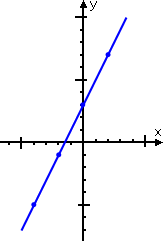
Since "linear" equations graph as straight lines, I might as well use my ruler for this part, too. The blue line, together with the graphing area, is the answer they're looking for. Once I've connected our dots, I'm done with the exercise.

How do you graph a straight line?
In summary, follow these steps to graph a straight line:
- Create a T-chart.
- In your chart, pick at least three x-values, and compute the corresponding y-values.
- With a ruler (that is, with a straight-edge), draw the x-axis and y-axis.
- Draw a consistent scale on each axis; label some axis values, especially if you're not counting off by 1's.
- Plot the points from your T-chart onto the axis system.
- With your ruler against the line of points, draw the line for the straight-line equation.
By the way:
How do you graph a linear equation with two points?
To graph a linear equation with two points, your first step is to compute a third point. Graphing with just two points? Don't; just... please don't.
Because I'd plotted more than just two points in the exercise above, I knew — for certain — that my points were correct. If I'd plotted only two points, and one of those points had been computed incorrectly or been drawn badly, I wouldn't have known that I'd made a mistake somewhere. By plotting at least three points, I was confident that my graph was correct; any incorrect point would have been off to the side of the other points.
When graphing linear equations (that is, when graphing straight lines), always plot at least three points.
© 2024 Purplemath, Inc. All right reserved. Web Design by ![]()