


Graphing Radical Functions
Purplemath
The first two square-root graphs on the previous page showed the customary square-root shape of an arc with a restricted domain. The last graph on the previous page, though, looked more like a "V", but with a rounded turn at the bottom (in contrast to the sharp-elbowed turn expected on an absolute-value graph), and had no restrictions on its domain.

While most of the square-root functions you'll be given will graph as arcs, some will not, and these other-shaped graphs will become more common if you proceed to calculus.
However, the basic process will still be the same; namely, first find the domain, and then plot enough points that you have a good idea of where the graphed line should go. (And, of course, if you have a graphing calculator, check your work!)
-
Graph

In the last example on the previous page, the argument of the square root was, as here, a quadratic. However, that quadratic was an upward-opening parabola that was always above the x-axis, so it was always positive and the domain was "all x". Is this quadratic the same sort of thing?
My first step in graphing is to find the domain. To do this algebraically, I'll start by setting the argument of the square root to be equal to zero.
16 − x2 = 0
x2 − 16 = 0
(x − 4)(x + 4) = 0
x = −4, 4
Okay; if x is zero at two points, then I know that the parabola will cross the x-axis. So this domain will *not* be "all x"; the domain will be restricted.
So far, I've found where the quadratic argument is exactly equal to zero, but now I need to know where that argument is greater than zero. What do I do now? If I've studied how to solve quadratic inequalities, I can use that methodology. But suppose I haven't learned about that yet?
The two solutions (that is, the two zeroes) found above are where the argument of the square root crosses the x-axis; that is, they tell me where 16 − x2 is zero. These solutions split the number line (that is, the x-axis) into three intervals: (−∞, −4), (−4, 4), and (4, ∞). I need the interval(s) on which the 16 − x2 is above the x-axis.
Because I know that the original argument represents a downward-opening parabola, then the interval on which that parabola will be above the x-axis will be the interval in the middle. In other words, based on the graphing I've done in the past, I know that the parabola will be above the x-axis on the middle interval, so the domain for this square-root function will be restricted to the middle interval; namely, my domain here will be [−4, 4], where the square brackets remind me that the endpoints of the interval are included in the domain, too.
(If you're not sure about this, then do a quick graph of y = 16 − x2, and see where the graph is above and below the horizontal axis. The interval where the y-values are positive is (−4, 4), as shown below.)
So the interval between x = −4 and x = 4 will be the domain of this particular radical function. There will be absolutely nothing to graph before or after this interval.
Now I need to find some plot points in addition to the two zeroes that I already have. Because the values didn't work out nicely for this function, I used a calculator to approximate the y-values for my T-chart:
Finally, I'll do my graph:
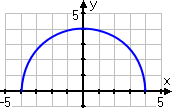
If you're thinking that my graph looks a lot like the top half of a circle, then you're exactly right. As a matter of fact, it's the top half of the circle that is centered at the origin and has a radius value of r = 4. (The negative of this square-root function would have given me the bottom half of the same circle.)
-
Graph

First, I'll find the domain. The argument of this square root is a "plus" quadratic, which I know graphs as an upward-opening parabola. I know that this argument will be positive where the corresponding parabola is above the x-axis. From what I know about graphing, I know that the domain for this square-root function will be the intervals on either side of the x-intercepts of the parabola, but not on the middle interval that is between the intercepts.
I find the intercepts by setting the argument equal to zero, and solving:
x2 − 4x = 0
x (x − 4) = 0
x = 0, 4
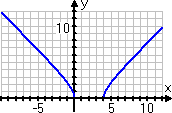
These two zeroes of the argument split the number line into three intervals: (−∞, 0), (0, 4), and (4, ∞). I expect the argument to be positive (that is, above the x-axis) on the first and third intervals, but negative (that is, below the x-axis) in the middle. To confirm, I'll look at the graph of parabola y = x2 − 4x:
As I'd expected, the quadratic argument is positive (that is, its graph is higher than the x-axis) before the first intercept at x = 0 and after the second intercept at x = 4.
The argument of the radical is positive on the two *unconnected* intervals on either end of the parabola's graph. In other words, the domain of the radical is split into TWO pieces which are not attached to each other.
This means that the graph of the radical function will also be in two pieces: one part on the left, stopping at x = 0, and another part on the right, starting at x = 4. There will be nothing but blank space between these two pieces.
Keeping this domain restriction in mind, I'll carefully find some plot-points, using my calculator to get decimal approximations for the y-values:
Finally, I'll do my graph:

Most of the radical-function graphing you'll be doing will involve square roots. But other roots can be graphed, too.
How do you graph cube-root functions?
To graph a cube-root function, first note that, in general, the domain of a cube-root function is "all x" (assuming there isn't something weird inside the cube root, like a rational expression or a square root). So graphing boils down to the usual process:
- Pick at least five x-values (though eight to ten, at a minimum, would be better).
- Plug the x-values into the cube-root function. Expect to need to use your calculator to get decimal approximations for the y-values. (Two or three decimal places should be fine for graphing.
- Use your ruler to draw a nice, neat axis system, and mark scales on each axis. (You should expect that your graph will be wider than it is tall.)
- Plot your points neatly.
- Draw a curve through your plotted points.
And, if you've got a graphing calculator, don't be shy about doing a quick graph to check your work.
-
Graph

There are no domain constraints with a cube root (or indeed for any other odd-index root), because it's perfectly okay to have a "minus" inside a cube root. This means that I can graph the cube root of a negative number. So, unlike when I'm working with a square root (or any other even-index root), I don't have to start by finding the domain; the domain is going to be "all x".
So I'll go straight to finding some plot points, using my calculator to find decimal approximations, as needed:
I was able to find some x-values that gave me nice y-values by setting the argument of the cube root equal to a perfect cube, such as −8 or 1, and solving for x. But, to get enough plot points to be sure of what the graphed line should be doing, I had to use some messy values, too. You should expect this messiness, when graphing radical functions.
My graph looks like this:
Note: Radicals graph as curved lines. Don't succumb to the temptation of trying to put a straight line through your plotted points, or trying to join the plotted points with line segments. Instead, use enough plot-points to clearly show the shape of the graph, and then draw the graph with its curves.
Also, you should expect most radical-function graphs to be more wide than they are tall, but don't assume that this will always be the case. Take your time, and remember that it's hard to go wrong with more plot points.
© 2024 Purplemath, Inc. All right reserved. Web Design by ![]()