


Graphing Linear Equations: Examples
Purplemath
What does a graph with a straight line mean?
A graph with a straight line means that the equation that created that graph is linear, and any relationship modelled by that equation has a linear relationship, meaning that, as one part of the relationship increases by 1, the other part of the relationship increases by some fixed set amount, like 2 or −5.

Linear relationship are the simplest relationships you can get. Things like "for every hour I work this week, I make another $15" are linear relationships.
How do you graph linear (straight-line) equations easily?
To graph linear equations easily, follow the basic steps:
- Make a T-chart to hold your values.
- Plug at least three x-values into the equation to find their y-values.
- Fill your T-chart with the x-values you picked, and their corresponding y-values.
- With your ruler, draw a neat set of axes, and clearly mark the scale on each axis.
- Plot the points neatly on your (ruler-drawn) axis system.
- Put your ruler against the points and draw the line for the equation.
As long as you do your work neatly and orderly, you shouldn't have too much trouble with graphing straight-line equations.
- Graph
First I'll do my T-chart, starting with picking some x-values. I usually pick values that are near zero, but I make sure to pick points that aren't necessarily right next to each other. A good spread of points helps me to be sure of where the line goes on the graph.
In this particular case, I am multiplying the variable x by a fraction that has 3 as its denominator. Because of this, I will pick x-values that are multiples of 3. This means that, when I plug my value for x into the linear equation, the denominator will cancel out and I won't have to deal with fractions. (Why? Because fractions can be a pain, and I'm lazy.)
I picked these points because they are multiples of 3, because they have a nice spread (but not *too* spread out), and because they include at least one negative x-value. (Don't be afraid of negatives.)
Now that I've filled my T-chart, I'll plot my points and draw my graph:
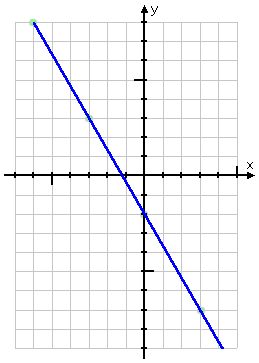
The graphing area above was sized to suit my T-chart points. Don't feel like every graphing area has to be ten or twenty units in each direction, with the origin exactly in the middle. It's perfectly okay to draw what fits your points (including having the origin off to one side or the other) and what suits your taste. Just make sure that it's suitably large and clear, so the grader knows what you mean.
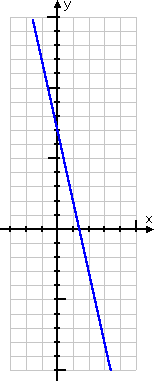
- Graph y = 7 − 5x
The variable x is multiplied by a larger value here; it's multiplied by 5. So I should expect that my y-values will grow fairly quickly. This means that I should expect a fairly tall, skinny graph.
First I'll pick my x-values to be fairly close together, so my graph isn't impossibly tall. Then I'll compute the corresponding y-values, so I can fill in my T-chart. Because my x-values are going to be close together, I'm going to plot more than just the minimum three points, so that I can be sure that my graphed line is correct.
(The equation for this exercise is an example of a situation in which you will probably want to be particular about the x-values you pick. Because the x is multiplied by a relatively large value, the y-values grow quickly.
(For instance, you probably wouldn't want to use x = 10 or x = −7 as inputs, as they would result in y = −43 and y = 42, respectively. You could pick larger x-values if you wished, but your graph could become unwieldy; that is, it could be unpleasantly awkward).
I can see, from my T-chart, that my y-values are getting pretty big on either end (that is, in the positive numbers above the horizontal axis, and in the negative numbers below the horizontal axis). I don't want to waste time computing points that will only serve to make my graph ridiculously large, so I'll quit with what I've got so far. But I'm glad I plotted more than just two points, because lines that start edging close to being (or at least feeling) vertical can easily go wrong, especially if I'm not neat in my work.
Here's my graph:
When you're doing a graphing exercise, the nice neat graph is the answer they're wanting. There's nothing more to do.
- Graph y = 3
I shouldn't let this equation or graph scare me. Yes, there is no "x" in the equation, but that's okay. I just think about it this way:
It simply doesn't matter what x-value I might pick because the equation doesn't care what x is; the y-value will always be 3, regardless of what x might be.
Really; it doesn't matter. At all. I could pick 10,007 for x, and y would still equal 3. I could pick −4,000,316 for x, and y would still equal 3. Heck, I could pick 😈 for my x-value, and y would *still* equal 3.
As a result, my T-chart will look something like this:
No, I'm not going to plot the point (x, y) = (100, 3), but my T-chart emphasises what's going on here. It doesn't matter what value I pick for x; the value for y is always going to be 3.
As a result, my graph looks like this:
This is always true: Any time you have an equation of the form "y equals (a number)", with no x in the equation, the graph will always be a horizontal line passing through the y-axis at a height of whatever (that number) is.

- Graph x = 4
I shouldn't let this equation scare me, either. Yes, there is no y in the equation, so I can't solve for "y =", but that's okay. The reasoning for this linear equation works just like the previous example: No matter what the y-value might happen to be, the corresponding x-value is always going to be 4.
(Yes, I'm kind of working backwards, but that's okay. All I need are plot points. I don't necessarily always have to go forwards, from x-values to y-values, to get my plot points. Going backwards is fine, too.)
So I'll do my T-chart backwards, picking various y-values, while always putting 4 as the corresponding x-values:
No, I'm not going to plot the point (x, y) = (4, 100), but the point emphasises for me that, for this line, all the x-values are going to be 4, regardless of what the corresponding y-value might have been. So my graph fills in like this:
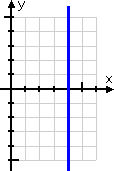
This is always true: Any time you have an equation of the form "x equals (a number)", with no y in the equation, the graph will always be a vertical line passing through the x-axis at whatever (that number) is.
What are the three types of straight-line equations?
You should know that linear equations come in three forms:
- regular linear equations: their equations have both x and y in them, and their graphs are slanty straight lines (that is, the lines graph at an angle to the two axes)
- horizontal linear equations: their equations have a y but no x, and their graphs are horizontal lines at a height above (or below) the x-axis of whatever is the number that y is equal to
- vertical linear equations: their equations have an x but no y, and their graphs are vertical lines parallelling the y-axis at whatever distance from zero is the same as the number that x is equal to
Nearly all of the linear equations that you'll graph will be of the "regular" type, but you should expect to be able to graph and recognize vertical and horizontal lines, too. At least one vertical or horizontal line will be on the next test, and probably one on the Final, too.
© 2024 Purplemath, Inc. All right reserved. Web Design by ![]()