


Regression Models, Interpolation, and Extrapolation
Purplemath
Until (and unless) you get into a statistics class, the preceding pages cover pretty much all there is to scatterplots and regressions. You draw the dots (or enter them into your calculator), you eyeball a line (or find one in the calculator), and you see how well the line fits the dots. About the only other thing you might do is "extrapolate" and "interpolate".
The prefix "inter" means "between", so interpolation is using a model to estimate (or guess) values that are between two known data points. The prefix "extra" means "outside", so extrapolation is using the model to estimate (or guess) values that are completely outside of the known data points.

(The "-polation" part comes from the Latin, and can mean "polish", "smooth", or "amend". So you're taking some data, smoothing things out with a regression model, and adding more points, both inside and outside the current data set.)
Remember that the point of all this data-collection, dot-drawing, and regression-computing was to try to find a formula that models... whatever it is that they're measuring. You can use these models to try to find missing data points (interpolation) or to try to project into the future or, sometimes, into the past (extrapolation).
If you have data, say, for the years 1950, 1960, 1970, and 1980, and you find a model for your data, you might use it to guess at values between these dates. For instance, given Namibian population data for these years, you might try to guess the population of Namibia in 1965 Since this year falls between the known data points at 1960 and 1970, this estimation would be an interpolation. On the other hand, you might want to estimate the population for 2040; this projection (into the future), for a date completely outside of the known data points, would be an extrapolation.
-
Find a regression equation for the following population data, using t = 0 to stand for 1950. Then estimate the population of Namibia in the years 1940, 1997, and 2005. Note: Population values are in thousands.
| Year (t=0 : 1950) |
Population (in '000) |
| 0 | 511 |
| 5 | 561 |
| 10 | 625 |
| 15 | 704 |
| 20 | 800 |
| 25 | 921 |
| Year (t=0 : 1950) |
Population (in '000) |
| 30 | 1,018 |
| 35 | 1,142 |
| 40 | 1,409 |
| 45 | 1,646 |
| 50 | 1,894 |
Okay; they've given me quite a bit of data, and they're wanting me to both interpolate (for the year 1997) and extrapolate (for the years 1940 and 2005). The "population" values are comparitively large, so I'll need to make a sensible adjustment to my axes.
In my graphing calculator, I set my window range as 0 ≤ X ≤ 55, counting by 5's, and 500 ≤ Y ≤ 2000, counting by 250's. My calculator gives me the following scatterplot:

The dots look like they line up in a curve, so I'll try a quadratic regression. The calculator gives me:
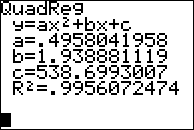
As you can see, I've set the calculator to "DiagnosticsOn", so it displays the correlation value whenever I do a regression. The regression value (that is, the "R2" value) looks pretty darned good. How does this model compare with the data points? I'll overlay the graph:

So, yeah; that's an excellent match. I won't bother trying any other regressions. I'll stick with the equation represented by the above-listed coefficients (rounding to four decimal places):
f (x) = 0.4958x2 + 1.9389x + 538.6993
Now that I have an equation for modelling Namibia's population, I can use it to estimate the population in the given years. For the year 1940, I'll use the input value t = −10, because 1940 is ten years before 1950. (This is an extrapolated value, since I'm going outside of the data set.)
f (−10)
= 0.4958(−10)2 + 1.9389(−10) + 538.6993
= 568.8903
When interpreting this value, I need to remember that the population is given, in the original data set, in terms of thousands. So the above value actually means "568,890.3". Obviously, I'll be ignoring the fraction of a person (being the "point-three"), because this makes no physical sense.

For the year 2005, I'll use the input value t = 55; this will be another extrapolated value.
f (55)
= 0.4958(55)2 + 1.9389(55) + 538.6993
= 2145.1338
This answer is in thousands, and the data set's values don't include the final three zeroes. To convert this to real-world terms, I need to add those three zeroes back on, to get a value of 2,145,133.8, which (rounding in the way the table's values were) about 2,145,000, which is 2.145 million. (Note: It is common to use "m" after a value to indicate "millions", so this can also be written as "2.145m".)
For the year 1997, I'll use the input value t = 47, because 1997 is 47 after 1950. Since this value is between two known values, my result will be an interpolated value.
f (47)
= 0.4958(47)2 + 1.9389(47) + 538.6992
= 1725.0498
Remembering that the population values are in thousands, I'll add three zeroes to my numbers and round to get my final answers.
1940: 569,000
2005: 2.145m
1997: 1.725m
Note that interpolated values are usually much more reliable than are extrapolated values. For instance, the model above predicts the 2017 population to have been 2,894,252; however, at the time of this writing, the United Nations Department of Economic and Social Affairs states the population as having been 2,533,794. My model was off by a bit more than 14%. So... not good.
Depending on your calculator, you may need to memorize what the regression values mean. On my old TI-85, the regression screen would list values for a and b for a linear regression. But I had to memorize that the related regression equation was "a + bx" (instead of the "ax + b" that I would otherwise have expected) because the screen didn't say.
If you need to memorize this sort of information, do it now, because the teacher will not bail you out if you forget on the test what your calculator's variables mean.
© 2024 Purplemath, Inc. All right reserved. Web Design by ![]()