


Numerical Approximation of a Zero: Midpoint Method
Purplemath
What is numerical approximation?
Numerical approximation is the process of getting really close to a target value, especially when you have no exact or formulaic way of finding that value. The process usually involves picking an interval around the target value, and moving closer and closer to the target by nibbling away at that interval.

What is an exact, versus an approximated, value?
In mathematics, the "exact" value will be one with a "closed form" expression, being an expression that can be written without any trailing dot-dot-dot. For instance, is the exact form of the square root of 2, while 1.414213562... is a decimal approximation. Another example comes from geometry, where π is the exact form of the number which is often approximated as 3.14159 or .
You can always find the exact zeroes of a quadratic equation, because you have a formula; namely, the Quadratic Formula. This formula allows you to find the "exact" roots, even when they involve square roots.
What about cubics, quartics, and higher-degree polynomials?
There do exist formulas for solving cubic and quartic equations exactly. But these formulas are so complicated that you'll likely never see or hear of them, let alone have to figure out how to use them. And there are no general formulas for higher-degree polynomials at all.
(Asides: "The Scandalous History of the Cubic Formula" and "Solving the Quartic with a Pencil")
Why do we need numerical approximation?
For many (most?) polynomials, we simply can't find nice neat solutions. There are no general formulas for solving higher-degree polynomials, so we may not be able to find the exact values of any of the roots of that polynomial. So, to find the roots of these messy higher-degree polynomials, we must instead try to find the approximate the values for those roots.
When you are asked (in an algebra class) to find the zeroes (that is, the x-intercepts, the solutions, or the roots) of a polynomial equation, you will almost always be given a polynomial that is actually solvable in some straightforward manner. The polynomials will be carefully structured so that you can find the exact solutions.
But most polynomials (in "real life") aren't solvable. How do you find their zeroes? You don't, at least not exactly. Instead, you find a numerical approximation to some degree of accuracy. (This "to some degree of accuracy" answer is what you get when you punch buttons on your graphing calculator to find the root of a graphed equation.) How does this work?
What is the continuity property of polynomials?
The "continuity property" of polynomials says that, if your polynomial equals, say, 5 at some value of x and equals, say, 10 at some other value of x, then the polynomial takes on every value between 5 and 10 because polynomials graph as continuous (that is, as connected) lines. They don't have gaps or jumps or angles or elbows; they don't do anything hinky or unexpected; they're just nice smooth solid connected curvy lines.
How does continuity help with numerical approximation?
If your polynomial is negative (that is, if its graph is below the x-axis) at one spot and positive (that is, above the x-axis) at another spot, then it has to be true that the polynomial takes on the value of zero somewhere in between those two x-values, because zero falls between the negatives and the positives.
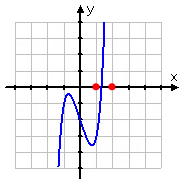
For example, let's look at the polynomial function y = x5 + x3 − 3x − 2:
You can quickly see from the graph (below) that the polynomial is negative (below the axis) at x = 1 and positive (above the axis) at x = 2. (Specifically, for x = 1, y = −3; for x = 2, y = 32.) Then the polynomial must be zero (that is to say, it must cross the x-axis) somewhere in between x = 1 and x = 2. To find the zero, you would start looking inside this interval.
Note: In practice, you'll probably be given x-values to use as your starting points, rather than having to find them yourself from a graph. In these cases, one of the x-values will give a negative value for the polynomial and the other will give a positive value. This is similar to when you use your calculator to find zeroes on a graph, and the calculator asks you to pick left- and right-hand bounds for the zero.
There are two methods for narrowing in on a polynomial's zero: using midpoints, and picking clever values for x. I'll show midpoints first.
What is the method of midpoints?
The method of midpoints is a process for finding x-intercepts (that is, of finding real-number solutions to equations) that uses interval midpoints to narrow down the interval in which the zero lies. By making the interval containing the solution half the size at each step, you can get closer and closer to the actual value of the intercept.
To use the method of midpoints, you will usually (in the class where you're studying the topic) be given a beginning interval. In "real life" (such as other classes, labs, etc, where you need to approximate zeroes), you'll have to find that beginning interval yourself. If you have to find the beginning interval yourself, you'll need to find an x-value for which the function's value (that is, the y-value) is negative, and find another x-value where the function is positive. These two x-values will be the endpoints of your initial interval.
Once you have your beginning interval [a, b], follow these steps:
- Note the signs of the function's values at each of the endpoints.
- Find the x-value that is the midpoint between the interval's endpoints; that is, add the two x-values, and divide by 2.
- Find the value of the function at the interval's midpoint; in particular, find the sign of the function at the midpoint.
- Note the interval endpoint that has the same sign. Between that endpoint and the midpoint, the function's sign is the same, so there is no zero on this half of the interval.
- Discard this same-sign half of the interval. The midpoint and the other endpoint now bracket your new interval.
- Repeat steps (1) through (5), until the values of the endpoints match to whatever is the desired number of decimal places. Once they have, say, the same four digits after the decimal place, you'll take that portion of the endpoints' values as your decimal approximation of the x-intercept.
What is an advantage of the method of midpoints?
The midpoint method will always eventually get you to the value you want. Also, because you're always using the interval's midpoint, the process is easy to program. (For instance, if you're in a computer-science class and need to write a program to find x-intercepts, given a starting interval, this method of "add, and then divide by 2, is very easy to program.)
What is a disadvanage of the midpoint method?
If you have a graphing utility, so you can see the graph of the function, you can almost always zoom in on the x-intercept and pick better values than the midpoint. The midpoint method will always work, but it can take you a lot longer, especially if you're working "by hand".

The following is an example of finding a decimal approximation of an x-intercept by using the method of midpoints.
- Given the polynomial x5 + x3 − 3x − 2, find its zero on the interval 1 ≤ x ≤ 2, accurate to three decimal places.
Right now, I only know that the zero is somewhere between x = 1 and x = 2 — because that's the interval they've given me. (But, to confirm, I also cheated and looked at the graph of the polynomial to be sure.)
The input x = 1 returns a value of y = −3 and the input x = 2 returns a value of y = 32. To proceed from this point, I use the fact that polynomials' graphs have no breaks.
The signs on the two endpoints means that the graph is below the x-axis for the first input and above the x-axis for the second input. So, since the polynomial is continuous, it *must* therefore have crossed the x-axis at some spot between the two interval endpoints. But where, exactly? That's what I need to figure out.
To get closer to the zero by using midpoint method, I will split the difference between two inputs, literally: I'll reduce the size of the interval that I'm using for approximation by cutting the interval in half.
The midpoint between x = 1 and x = 2 is x = 1.5; this x-value splits the original interval into two equal halves.
Plugging x = 1.5 into the polynomial, I get y = 4.46875. The actual y-value isn't as important as the sign: since the polynomial is positive here, then the graph is above the axis here. Since the polynomial is positive at x = 1.5 and also at x = 2, but is negative at x = 1, I now know that the zero has to be between x = 1 and x = 1.5.
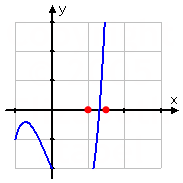
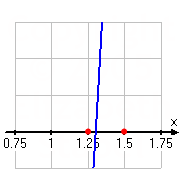
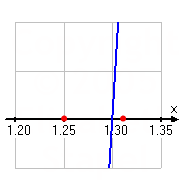
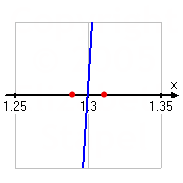
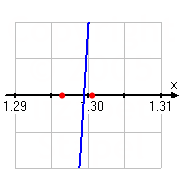
(The new interval endpoints, bracketing the zero, are marked in red on the graph below.)
So I'll split the difference again. The halfway point between x = 1 and x = 1.5 is x = 1.25. For this input, the output is y = −0.745117, approximately. The important thing to note is that this is a negative y-value. The polynomial is positive at the x = 1.5 endpoint, so the new bounds on my interval are x = 1.25 and x = 1.5.
This interval is halved at x = 1.375. (I am taking the average of the two x-values to find my midpoints.) This gives me y = 1.38950, approximately, which is positive. So I'll keep x = 1.25 as the lower endpoint and use x = 1.375 as the new upper boundary.
The midpoint between x = 1.25 and x = 1.375 is x = 1.3125, which gives y = 0.218389, approximately. Since the polynomial is positive here, I'll keep x = 1.25 as the lower boundary and use x = 1.3125 as the new upper boundary.
The midpoint between x = 1.25 and x = 1.3125 is x = 1.28125, which gives y = −0.287664, approximately. Since the polynomial is negative here, I'll keep x = 1.3125 as the upper boundary and use x = 1.28125 as the new lower boundary.
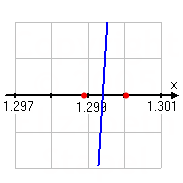
The midpoint between x = 1.28125 and x = 1.3125 is x = 1.296875, which gives y = −0.40913, approximately. Since the polynomial is negative here, I'll keep x = 1.3125 as the upper boundary and use x = 1.296875 as the new lower boundary.
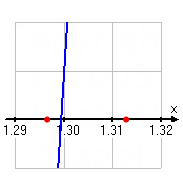
As you can see, I'm getting a lot closer to where the zero is.
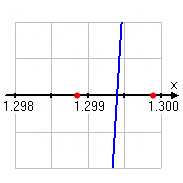
The midpoint between x = 1.296875 and x = 1.3125 is x = 1.3046875, which gives y = 0.87143, approximately. Since the polynomial is positive here, I'll keep x = 1.296875 as the lower boundary and use x = 1.3046875 as the new upper boundary.
The midpoint between x = 1.296875 and x = 1.3046875 is x = 1.30078125, which gives y = 0.0227196, approximately. Since the polynomial is positive here, I'll keep x = 1.296875 as the lower boundary and use x = 1.30078125 as the new upper boundary.
You've probably got the idea by now, so I'll just show the rest of my computations:
Midpoint: 1.298828125
y-value: −0.0091952439
Lower endpoint: 1.298828125
Upper endpoint: 1.30078125
Midpoint: 1.299804688
y-value: 0.0067375297
Lower endpoint: 1.298828125
Upper endpoint: 1.299804688
Midpoint: 1.299316407
y-value: −0.0012350122
Lower endpoint: 1.299316407
Upper endpoint: 1.299804688
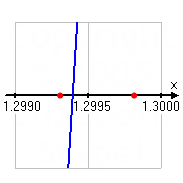
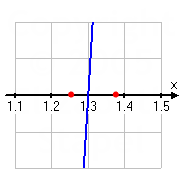
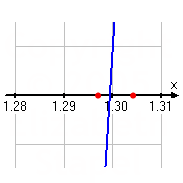
The last midpoint becomes the new lower boundary of the interval, and I now have bracketed the polynomial's zero between x = 1.299316407 and x = 1.299804688. Since these two x-values agree in the first three decimal places, I'm done.
So the approximate value of the polynomial's zero, to three decimal places of accuracy, is located at:
x = 1.299
© 2024 Purplemath, Inc. All right reserved. Web Design by ![]()